It's coming up, so here's a fine instructional video. Belly boards are your secret to always getting a fun ride no matter the conditions.....
Sabtu, 29 Agustus 2015
Jumat, 28 Agustus 2015
Beach hunting after a strong coastal storm
With tropical storm Erika making its way to Florida, my inbox has been full of messages from people asking for post storm beach hunting tips, so heres a few tips.
When beaches are safe to search with a metal detector after a major storm has eroded beaches, you can find anything almost anywhere on the beach.
You may also find almost anything anywhere on the beach for several days after a major storm has blown through an area.
Patience can be a virtue if you wait for the wind and waves to erode the beaches, instead of hammering a beach during and straight after a storm.
I remember a few years ago hitting a Treasure Coast beach with a six feet cut running for a couple of miles.
Walking off that shipwreck beach I could not believe I had to go home empty handed, especially as I had the beach all to myself for about four hours.
I returned to the exact same beach three days later to see if anything had washed back in with the returning sand.
Three silver Spanish reales were my reward for trying again, this is a prefect example of why you do not always have to be the first person at an eroded beach to recover good stuff.
After patience comes equipment choice, always use a good metal detector you have experience with and confidence in its abilities to detect what you are looking for.
Dont bring a gun to a knife fight, on a beach with several feet of sand removed from it, try not to worry about deep targets.
Im my opinion, a VLF metal detector with a little discrimination is the best tool for searching eroded beaches with plenty of relatively shallow targets.
Go for the easy targets within reach using a good VLF metal detector as most beaches are very trashy after being eroded by a storm.
A pulse induction metal detector is a better choice of equipment for covering areas that have obviously been heavily hunted by other people metal detecting.
You have the advantage of target depth, after all the easier to detect targets are recovered on an eroded stretch of beach by people using VLF metal detectors.
An often over looked factor is fatigue, try to use lightweight or balanced treasure hunting gear, so you can stay out on the beach longer instead of nursing a sore metal detector arm at home.
Also rely on your own beach hunting intuition or instincts, instead of second hand and dated beach reports, make your own headlines instead of hearing about what other people have found.
Beach erosion is when your knowledge of local beaches becomes a huge advantage.
You can pick and plan the sites you are going to search after a storm, I often think about places I have found lots of great stuff and the conditions needed to open them up.
For a beach hunter there is not greater thrill than searching an eroded stretch of beach and filling your finds pouch.
After you have searched an eroded beach, you will be more prepared to know what to do when it happens again.

Credit conscious consumers
If anything good came out of the Great Recession, it was the lesson—for consumers, at least—that debt can be a very unpleasant thing to have when the going gets rough. Consumers have taken that message to heart, by managing their credit card debt more carefully.

As the chart above shows, credit card debt outstanding fell from a high of $866 billion in 2008 to $703 billion as of last June. Relative to disposable income, credit card debt fell by fully one third over the same period.

Reduced credit card debt, combined with rising incomes, has dramatically reduced the percentage of credit loans that banks have had to write off.

Consumer loan delinquency rates are at their lowest level over 25 years, and falling.
All of the above is consistent with the Fed's calculation of household leverage:

Bottom line: consumers and households have trimmed their exposure to debt and are managing their debt much more cautiously and conservatively. This is, arguably, one of the under-appreciated facts that contribute to a positive outlook for the future.
GDP stronger than expected
It's ironic that the stock market suffered a huge "correction" only days before the second revision to Q2 GDP growth came in surprisingly strong. Sometimes the market gets carried away by emotions, and sometimes the economic statistics get revised significantly after the fact, so it pays to keep an eye on the fundamentals as revealed by key market-based prices (e.g., real yields on TIPS, swap spreads, the dollar, gold).

I've long argued that real yields on 5-yr TIPS were a good indicator of the market's expectation for the trend of real economic growth. As the chart above shows, the two tend to track each other over time. Real yields on 5-yr TIPS have moved quite a bit higher over the past two years, and now we discover that the economy strengthened over that same period. The annualized rate of economic growth over the past two years was 2.7%, a good deal better than the 2.2% annualized growth since the recovery started in mid-2009. .

Despite the pickup in growth, however, the economy is still a lot smaller than it could/should have been. As the chart above shows, the shortfall in growth relative to long-term trends is about $2.8 trillion. Per year. We're talking about a lot of income that's being left on the table, and a lot of people unemployed or underemployed, most likely because of higher tax and regulatory burdens.

Yesterday's GDP revisions also gave us the first look at corporate profits after tax for the second quarter. They reached a new nominal high of $1.82 trillion. As the chart above shows, that puts corporate profits very close to an all-time high relative to GDP. From a long-term historical perspective, corporate profits have been exceptionally strong throughout the current business cycle expansion.

The chart above shows the PE ratio of the S&P 500 using the after-tax corporate profits (with adjustments for inventory valuation and capital consumption allowances and normalized in order to facilitate comparisons to reported PE ratios) as the "E" instead of trailing GAAP earnings. By this measure, the stock market at the end of June was trading very close to its long-term average valuation.
What does all this say? The economy is doing OK, and has even managed to improve somewhat in recent years, despite all the moaning and groaning. Corporate profits have been absolutely fabulous, and certainly supportive of higher equity prices. Stocks aren't in a bubble, and monetary policy hasn't stimulated the economy or caused equity prices to artificially inflate.
So why is the market so worried? Why is the Fed so worried about the economy that they have to keep interest rates at zero? Sure, things could be a lot better, but we're not talking about a fragile economy that needs an extraordinary dose of TLC (aka low interest rates) to survive. If we want things to improve, we need to look to fiscal policy, not the Fed.
Kamis, 27 Agustus 2015
Thunder Mountain Lake


But at the north end, where the bottom is more gradual, a beach has formed. More accurately, a small stream delta has formed, but there is sufficient wave action to have reworked it into a beach. A series of berms mark the progressive fall of the lake over the summer.

The source of the sediment is a small basin that yields grus (the granular remains of weathered granite) that the seasonal stream can easily carry to the lake. Most of the action probably happens in the early summer by water flowing from the melting snowpack or perhaps in occasional heavy rains. I suspect that lighter rains probably soak pretty fast into the porous soil and yield little surface flow to transport material, but this is not exactly a system I'm familiar with.
Rabu, 26 Agustus 2015
Chart updates II
Only two charts from yesterday merit updating today, one the result of a bounce in stock prices and a drop in fear, the other the result of a further decline in 2-yr swap spreads.

When stock prices move inversely to fear (as proxied in the above chart by the ratio of the Vix index to the 10-yr Treasury yield), it's a good bet that emotions are the primary driver. More and more this looks to be the case with the recent volatility in global equity markets.

Swap spreads typically lead or track credit spreads, but not recently. 2-yr swap spreads in the U.S. are now a mere 14 bps, while high-yield spreads remain somewhat elevated. Equity and corporate bond markets are nervous about a deceleration in China's growth and a possible slowdown in the U.S. economy. But swap spreads are about as low as they get, which is a good sign that markets enjoy a healthy degree of liquidity and a virtual absence of systemic risk. This further suggests that elevated fears may be groundless—since they are as yet unaccompanied by any deterioration in the financial and economic fundamentals.
The next two charts are updated versions of ones I have featured periodically. Both show that the commercial real estate and construction markets are quite strong. As such, they lend support to the notion that the economic fundamentals have not deteriorated, and the market's fears are arguably misplaced.

According to the folks at Co-Star, commercial real estate prices are booming. Prices have been rising at a 12-14% rate for several years now. This is one of the strongest economic indicators I've seen.

New business on the books of the nation's architectural firms is increasing, according to a survey by the AIA. This points to increased commercial construction activity over the next year.
Selasa, 25 Agustus 2015
Quarry Beach

 |
| Tafoni weathering in sandstone |


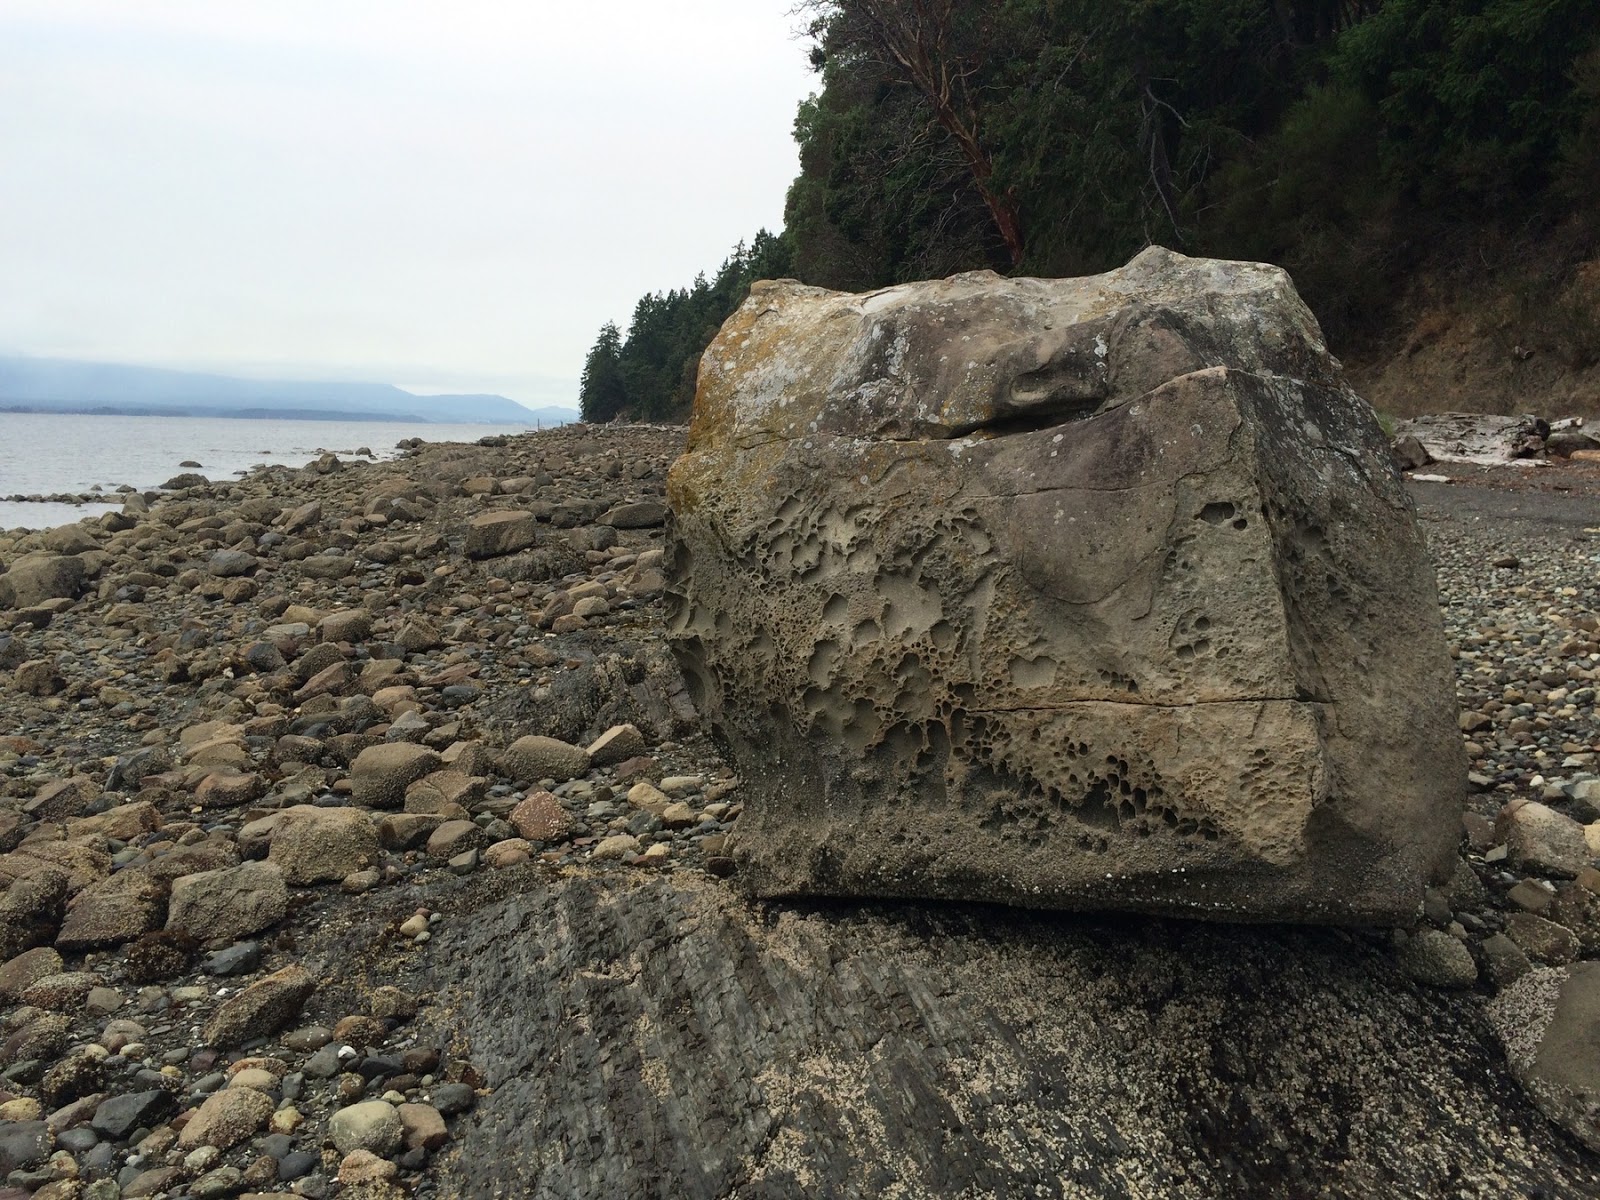
 |
| Could almost be a Seahawk |
Yeo Point


AERIAL VIEW


St Mary Lake


This relatively small lake on Saltspring Island has neither the waves nor the sediment to form natural beaches and is fringed by reeds everywhere except where the bedrock plunges too steeply to provide any shallow water where vegetation can take hold. And like most lakes in the great northwest, the original shoreline was probably once a tangle of fallen trees.
This beach is artificial, probably created many decades ago by cutting the vegetation, building two small rock groins, and dumping a few truckloads of coarse sand. I suppose they may have added a little sediment since, but in the 18 years I've been visiting it, I've seen very little change.
AERIAL VIEW

I thought I'd added this beach to my collection years ago, but apparently this is its first appearance in this blog. Ironic, given I've probably spent more time contemplating this beach than any other. It does show up regularly every August in my hshipman blog (here are posts from 2010, 2011, and 2012).

Chart updates
Given the rather extraordinary volatility and nervousness of the market, I'm going to post updates of key charts as I'm able, with minimal commentary.
The following charts show the most recent data as of today, Aug 25th:

High-yield credit spreads are rising, but still relatively low compared to periods of real economic distress. Swap spreads are declining, and are at levels which typically coincide with periods of economic tranquility.

The energy sector is clearly the one most impacted by current conditions (i.e, collapsing energy prices). Defaults are very likely. The market has already priced in defaults on energy bonds of roughly $45 billion. However, that's less than 1% of the value of outstanding traded corporate debt in the U.S.

All credit spreads have widened, but investment grade spreads are still relatively low and HY spreads are not at levels that are extremely worrisome (the energy sector accounts for most of the spread widening in the HY sector).

The Vix/10-yr ratio backed off a bit today, but is still VERY high, almost as high as it was at the apex of the PIIGS crisis in late 2011. The market is very fearful of the global economic and financial market fallout of a slowdown in the Chinese economy and collapsing energy prices. Lots of bad news is being priced in.

At 16.5 today, the PE ratio of the S&P 500 (according to Bloomberg) is equal to its long-term average.

In the great scheme of things, stock prices remain in a long-term uptrend. The recent selloff appears to be a minor bump in the road.

The prices of gold and 5-yr TIPS still appear to be slowly trending down. This suggests that the market is gradually losing the significant degree of risk aversion that it acquired in the wake of the PIIGS crisis. It also suggests that the market's demand for "safe" assets is declining on the margin. Both are consistent with a market that is regaining some lost confidence. This is of course very much at odds with the huge rise in the Vix/10-yr index, and is perplexing, to say the least.

Commodity prices have been trending down for several years now, but are still quite high relative to where they were a decade ago.
summer into fall table setting

With the end of summer drawing near, I am bringing a little more orange and gold into my home. A little pop of orange on the table can always elevate my mood. Grape vines strewn at the center of the table enhance the vibe of this tablescape, and a few wild flowers add brightness. Vintage glasses and bamboo flatware finish off the look. What’s your favorite color to use at your table?
ciao! fabiana
Senin, 24 Agustus 2015
Climbing an oil-slick China wall of worry
Falling oil prices and Chinese growth concerns have come together in perfect-storm fashion to send global financial markets into crisis mode. As I mentioned last week, what's going on seems to have more to do with fears than with any deterioration of the economic fundamentals. It's one more in a series of "walls of worry" that the market struggles to overcome—only this time it's an oil-slick wall of worry which makes the climbing more difficult.
It's impossible to say whether the global economy will unravel—sending shares lower still as the fundamentals finally do deteriorate—but the market seems to be pricing in a good chance of such a possibility. If you're going to panic and sell here, you need to be very worried that we are on the brink of a global economic disaster.

Crude oil prices have now fallen by almost 60% from last year's high. They've gone from being very expensive to now a bit cheap from a long-term historical perspective. I'd also note that virtually all recessions in the past 45 years have been preceded and/or triggered by relatively high prices of oil in real terms. With oil prices now into their second year of decline, we've seen only a brief slowdown in GDP, so I'm tempted to say that lower oil prices now make the economy less susceptible to a recession going forward. Cheaper oil is bad for producers, but very good for almost everyone else.

The key risk factor is how vulnerable the balance sheets of oil producers are to today's low prices. High-yield energy bond credit spreads are one way to evaluate that risk, and not surprisingly, they are high and worrisome. Nevertheless, the losses sustained by these bonds to date represent less than 1% of the value of all traded U.S. corporate bonds. This oil "tail" is unlikely to wag the corporate/economic dog, but that assertion does little to soothe a market that worries we're on the brink of another global recession.

As before, I think this chart is key. Despite the huge decline in oil prices, a substantial increase in high-yield credit spreads, and the recent 10% drop in equity prices, swap spreads are relatively low and declining. This is a stunning (and very reassuring) disconnect. If we were truly on the brink of another recession, swap spreads would almost surely be high and rising—but they're doing just the opposite. This lack of confirmation (the swap dog that didn't bark) points squarely to the current market rout being driven much more by panic than any deterioration in the economic fundamentals. The current level of swap spreads tells us that markets are very liquid and systemic risk is low. A big economic disruption is thus unlikely.

It's notable that oil's most recent decline has coincided with a decline in the value of the dollar. On a long-term time scale, oil prices tend to correlate inversely to the value of the dollar, as the chart above shows. I continue to believe that recent action tells us that lower oil prices are the result of a supply shock (think fracking) rather than overly-tight U.S. monetary policy. It's not a shortage of dollars that is depressing oil prices, it's a surfeit of supply, and that's good news for consumers.

The most welcome impact of falling oil prices is lower inflation expectations, as seen in the chart above. The market now expects the CPI to average about 1.1% over the next five years, mainly because of sharply lower oil prices. But when the bond market looks past the current oil decline, it sees the CPI averaging 1.9% over the subsequent five years—that's the message of 5-yr, 5-yr forward inflation expectations built into TIPS and Treasury prices. That's very much normal.

It's also notable that the prices of 5-yr TIPS (using the inverse of their real yield as a proxy) and gold have barely budged despite the recent global equity market turmoil. This is one of those scare scenarios that has caused large equity portfolio managers to hit the "sell" button—not a generalized unraveling of the global economy or financial markets.

The last time we saw a wall of worry this high was back in September 2011, when the PIIGS crisis reached its apex. Unlike today, however, swap spreads were high and rising in late 2011, as the world not only worried about the health of the Eurozone economy but also the health of the Eurozone banking system. Today, despite the huge increase in the Vix/10-yr ratio, swap spreads are low and declining.

U.S. and Eurozone equities suffered much greater losses in late 2011 than they have in the recent selloff. They rebounded nicely once the PIIGS crisis proved to be not so dangerous, and they can rebound again if the global economy fails to collapse.
And, by the way, US exports to China are only 0.7% of our GDP, so the health of the US economy is not terribly dependent on the health of the Chinese economy.