The April Producer Price Indices saw a lot of negative numbers (e.g., final demand -0.4% for the month, -1.3% for the year), but it's all due to falling energy prices. When there are huge swings in oil prices such as we've seen in the past year or so, it's entirely appropriate to focus on core measures (ex food and energy) of inflation. Doing so shows us that at the producer level, inflation has been running at about 2% a year for the past several years.
The chart above focuses on the total and core measures of the traditional version of the PPI (in recent years the BLS has begun releasing a new version called "final demand" which show inflation by both measures to be lower, but I'm sticking with the "finished goods" version that goes back decades for its historical value). Here we see how oil prices have introduced a huge amount of volatility to the total PPI. We also see that the core PPI has been running around 2% for quite some time. In fact, over the past 20 years, the annualized rate of increase in the core PPI has been 1.6%. We're not in some "new normal" world—when it comes to inflation, nothing much has changed for the past two decades.
The chart above subtracts the core PPI from the yield on 10-yr Treasuries. Here we seen that real interest rates today are back to the levels of the late 1970s. There has been a steady decline in real interest rates ever since the early 1980s. When real interest rates are zero or less, using leverage to buy things begins to become very attractive. It's not surprising therefore that there is a growing body of evidence that bank lending is picking up.
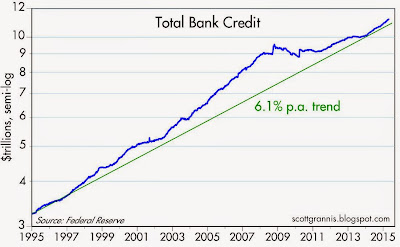
As the chart above shows, the growth of bank credit has been accelerating since early last year. Over the past six months, Total Bank Credit is up at a 10% annualized pace.
Now is not the time to worry about deflation. The Fed should begin to normalize interest rates to avoid excessive borrowing and rising inflation.
Kamis, 14 Mei 2015


0 Response to "No deflation in the PPI"
Posting Komentar